downtimeserversk8smonitoringkubernetes
[K8s] EP.2 Monitoring Downtime ตรวจสุขภาพ Server
Suvichan Prasongphonchai (The Duck Dose)·10/12/2023·~1 min read
โอ๊ย..เปิด Server ไม่กี่วันก็ล่มซะแล้วทำยังไงดี ?
## โจทย์ของเราในวันนี้
- จาก EP.1 server ของเราอยู่ที่บ้านทำให้ ล่มง่าย
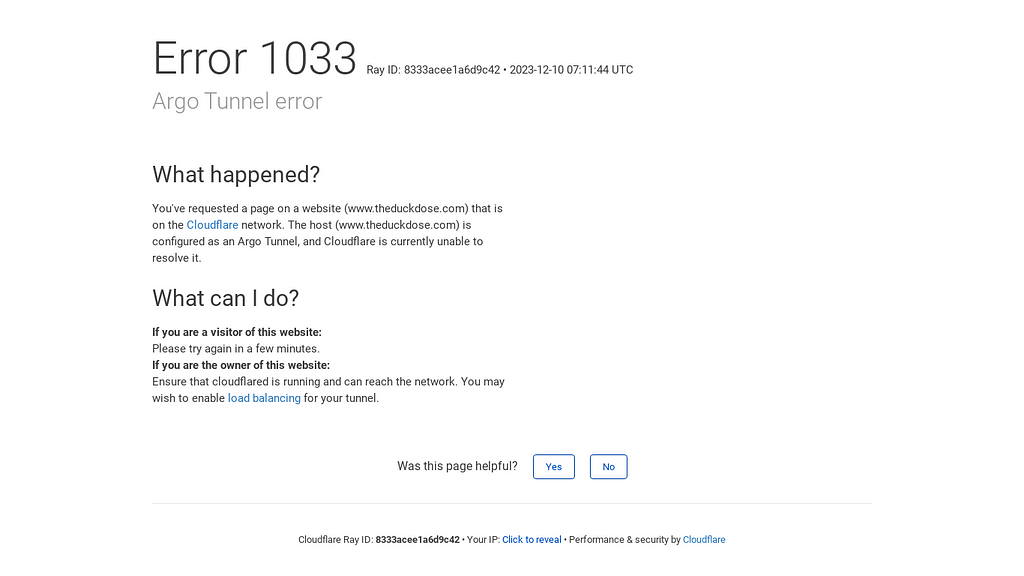
- เราไม่รู้ตัวเลยว่าล่มตอนไหน ต้องเข้าไปดูทั้งวันเป็น อ๊อด AI กว่าจะรู้ตัวก็ล่มไปนานแล้ว
- จะให้ Grafana + Alert ทำ Alert จาก Server เองก็ไม่ได้ เพราะ Grafana มันล่มไปด้วย 55555+
- อยากได้ Monitoring tools + Alert ภายนอกเวลาล่ม
ภายใต้ domain: https://status.theduckdose.com
## แต่เดี๋ยวก่อนมันล่มจากอะไร
- ปลั๊กหลุด > เดี๋ยวคงต้องย้ายที่วาง
- Internet ล่ม > แก้ไม่ได้แหะ ทำได้แค่รู้ตัวแล้วโทรไปแจ้งบริษัทค่ายเขียวแห่งหนึ่ง
- บ้านไฟดับ > เป็นกรรมของข้าเอง
- Notebook แบตเสื่อม > เปลี่ยนเถอะ
## ผมจึงเลือก
- เปลี่ยนแบต Notebook ใหม่
- และแท๊นนนแท๋นนนนน https://betterstack.com
มาช่วย Monitor https://www.theduckdose.com
## ทำยังไง
1.Register https://betterstack.com/
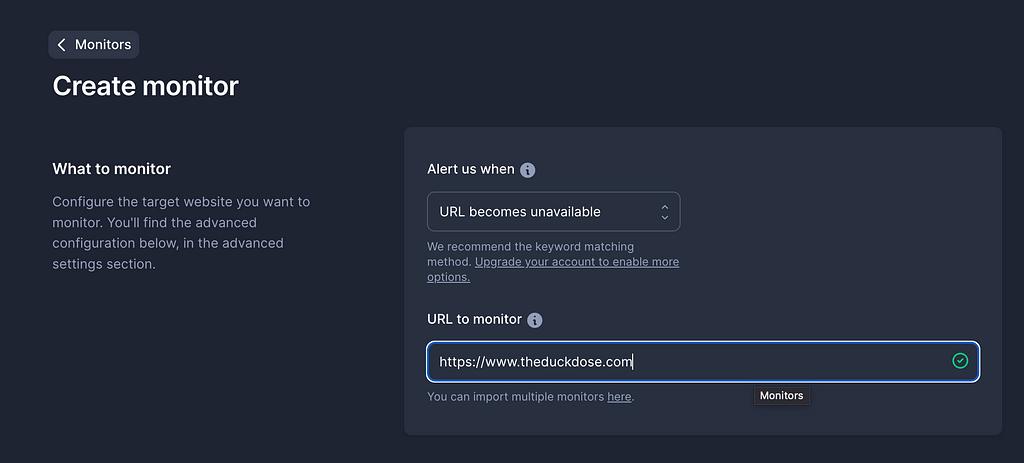
2.Monitoring > Create monitoring — ไม่ยากใส่ website ที่เราต้องการลงไป กด Create monitoring ด้านล่าง
3.สร้างหน้า Status page > Menu Status Pages > Create status page
4.ตั้งชื่อให้เค้าซะหน่อย ผมตั้ง the-duck-dose.betteruptime.com
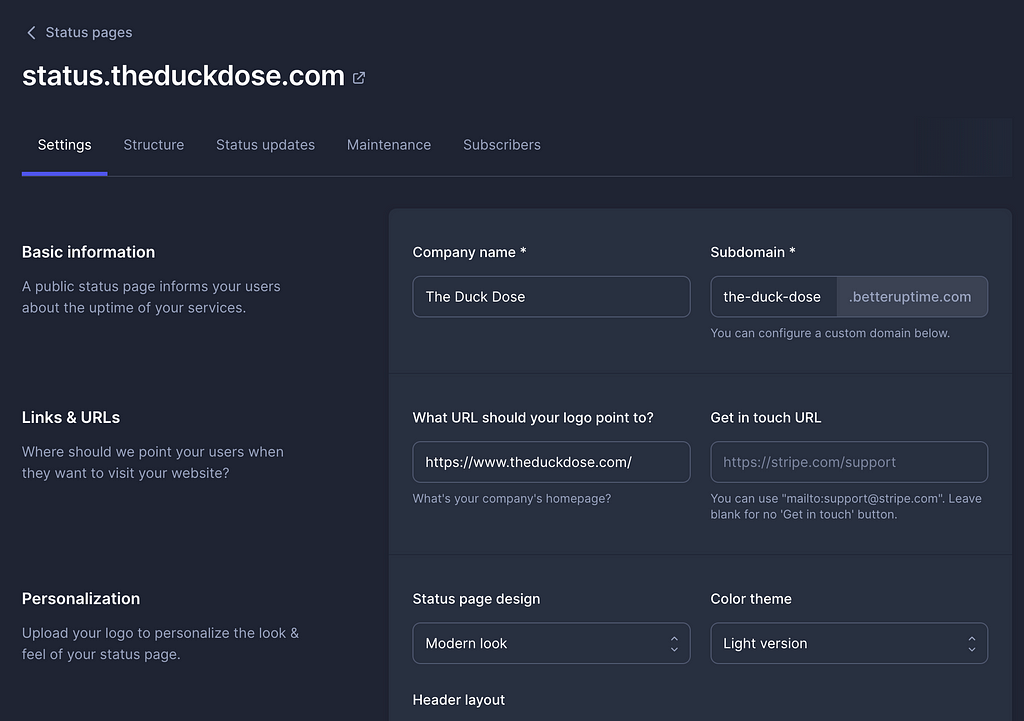
5.แต่ https://the-duck-dose.betteruptime.com มันใช้ domain คนอื่น
“มันไม่เท่” ย้ำ !! “มันไม่เท่” อยากใช้ domain ตัวเอง
เลื่อนไปด้านล่างใส่ Custom domain > “status.theduckdose.com”
Upload Logo เป็ดน้อยสุดน่ารักของเราลงไป
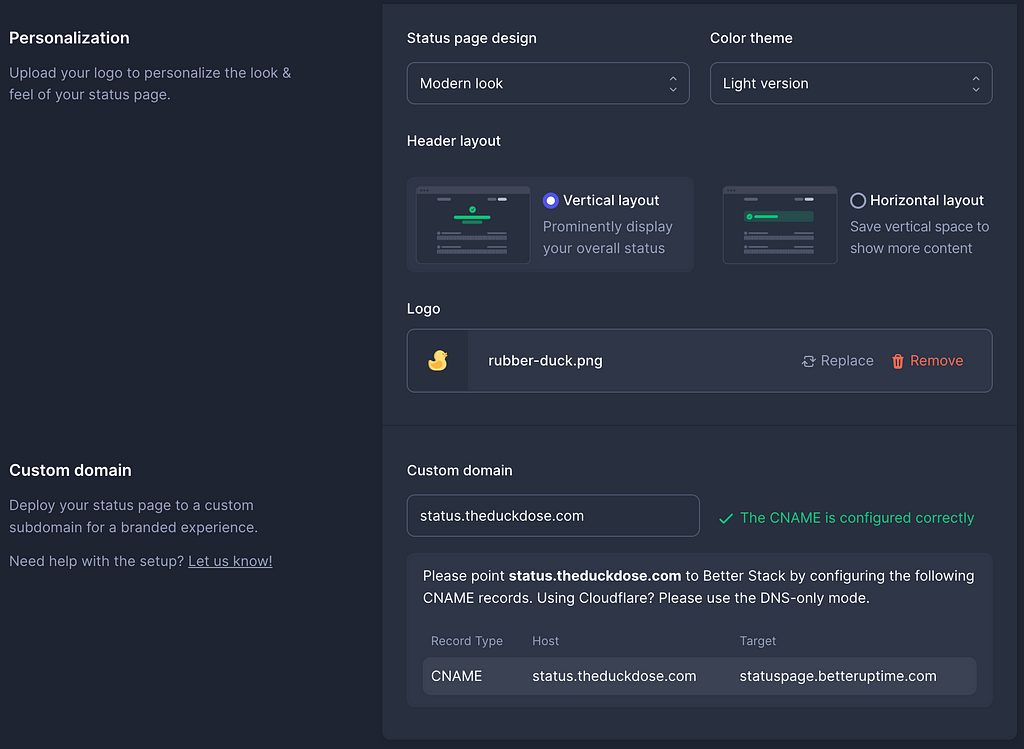
6.เข้า https://www.cloudflare.com/
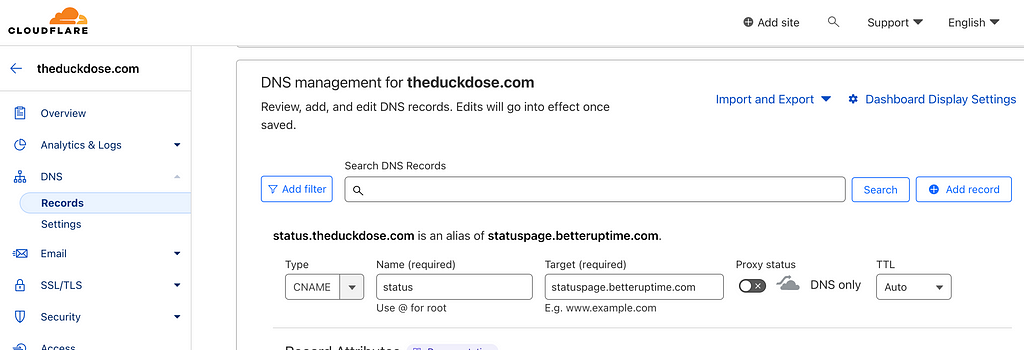
Domain > DNS > Records > Add record >
- Type: CNAME
- Name: status
- Target: statuspage.betteruptime.com
- Proxy status: turn off (DNS only)
7. เสร็จแล้วจ้า มาดูผลกัน
## ผลลัพธ์
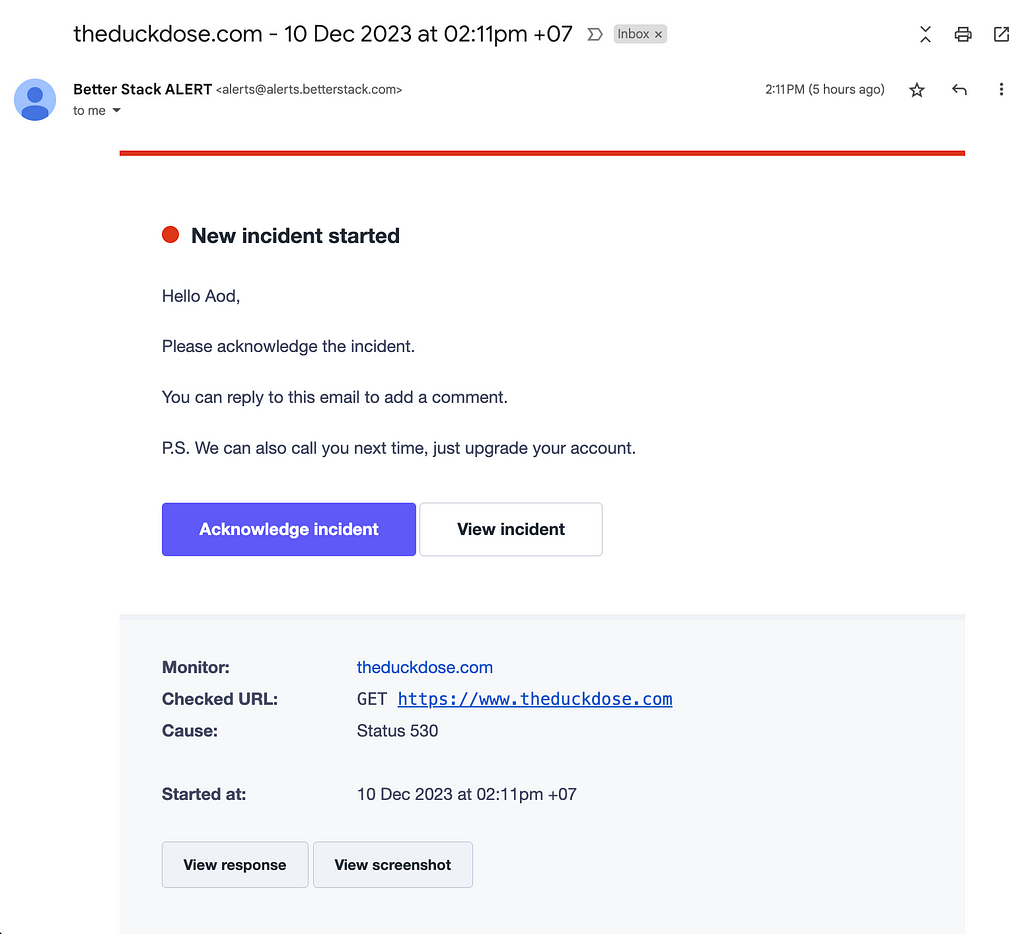
- มีหน้า Status เท่ๆ
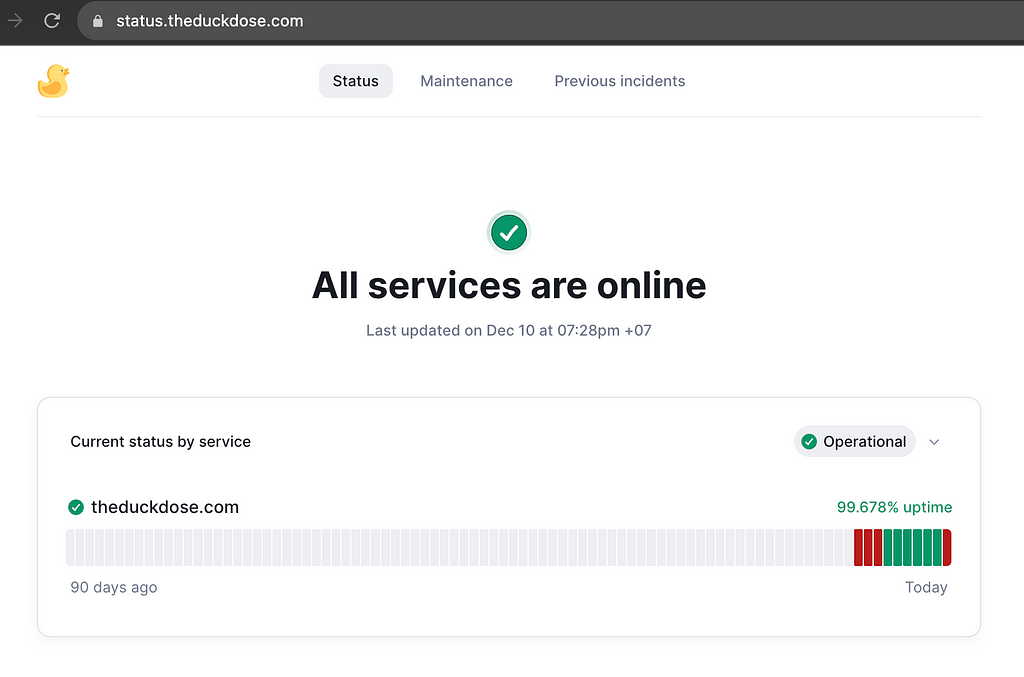
- มี Alert บอกเวลา website ของเรา down แถมดู screenshort ตอนเกิดได้ด้วยนะ